
in the crypto market, everything revolves around market capitalization — the total value of all circulating coins.
Indices like TOTAL, TOTAL2, TOTAL3, and OTHERS help traders see which segment of the market is driving momentum — whether it’s Bitcoin, Ethereum, or altcoins of different sizes.
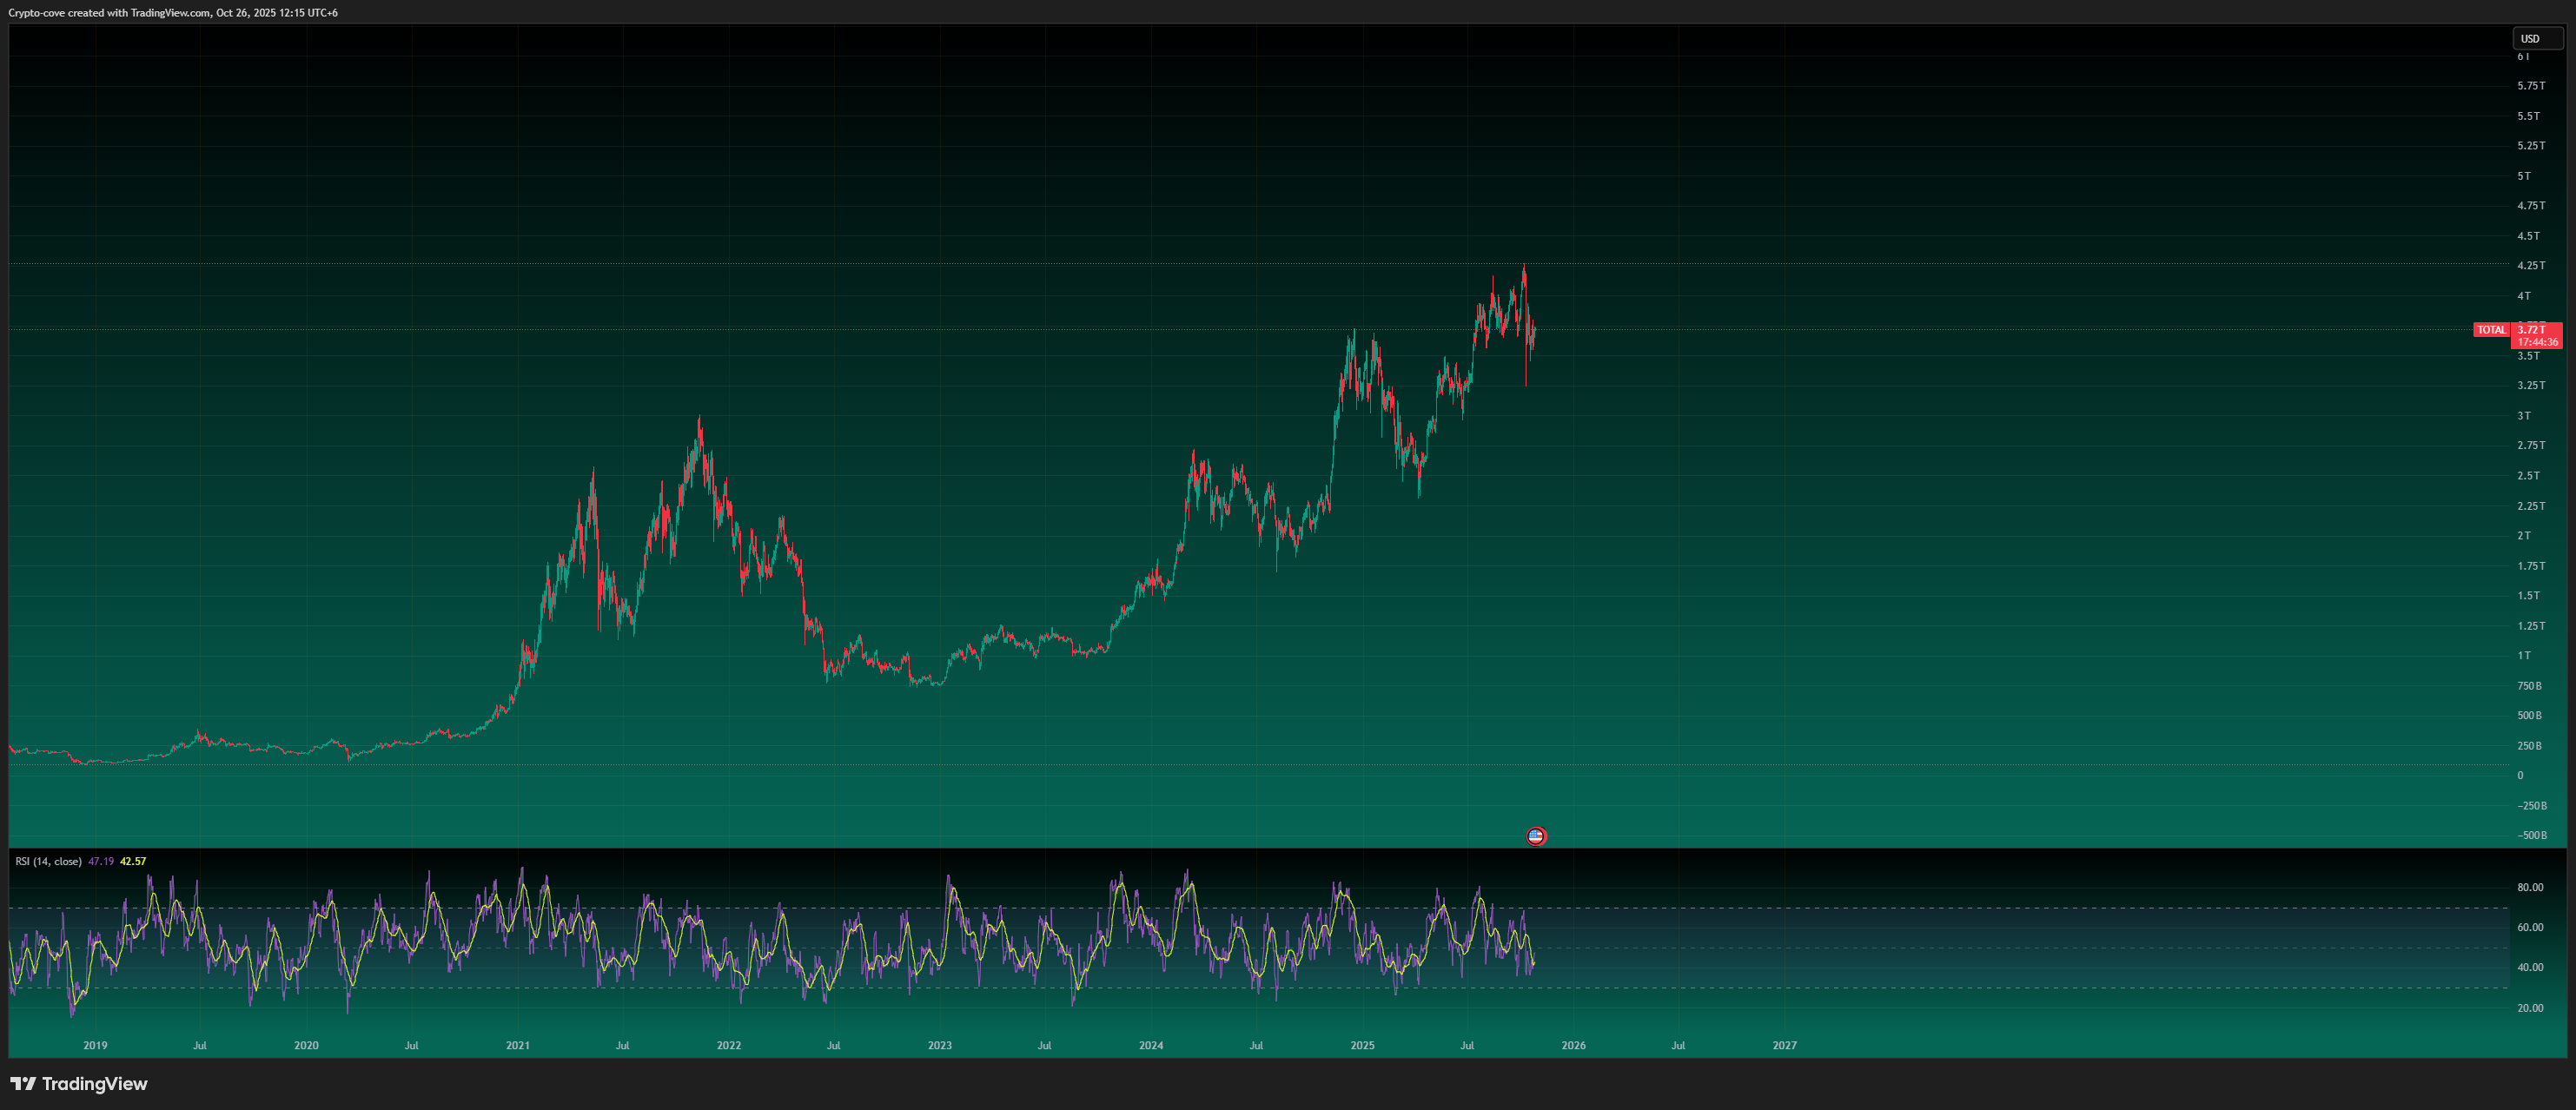
🪙 TOTAL – The Entire Crypto Market
TOTAL represents the combined market cap of Bitcoin, Ethereum, and all altcoins.
When TOTAL rises, it signals overall crypto market growth. When it falls, it shows market-wide weakness.
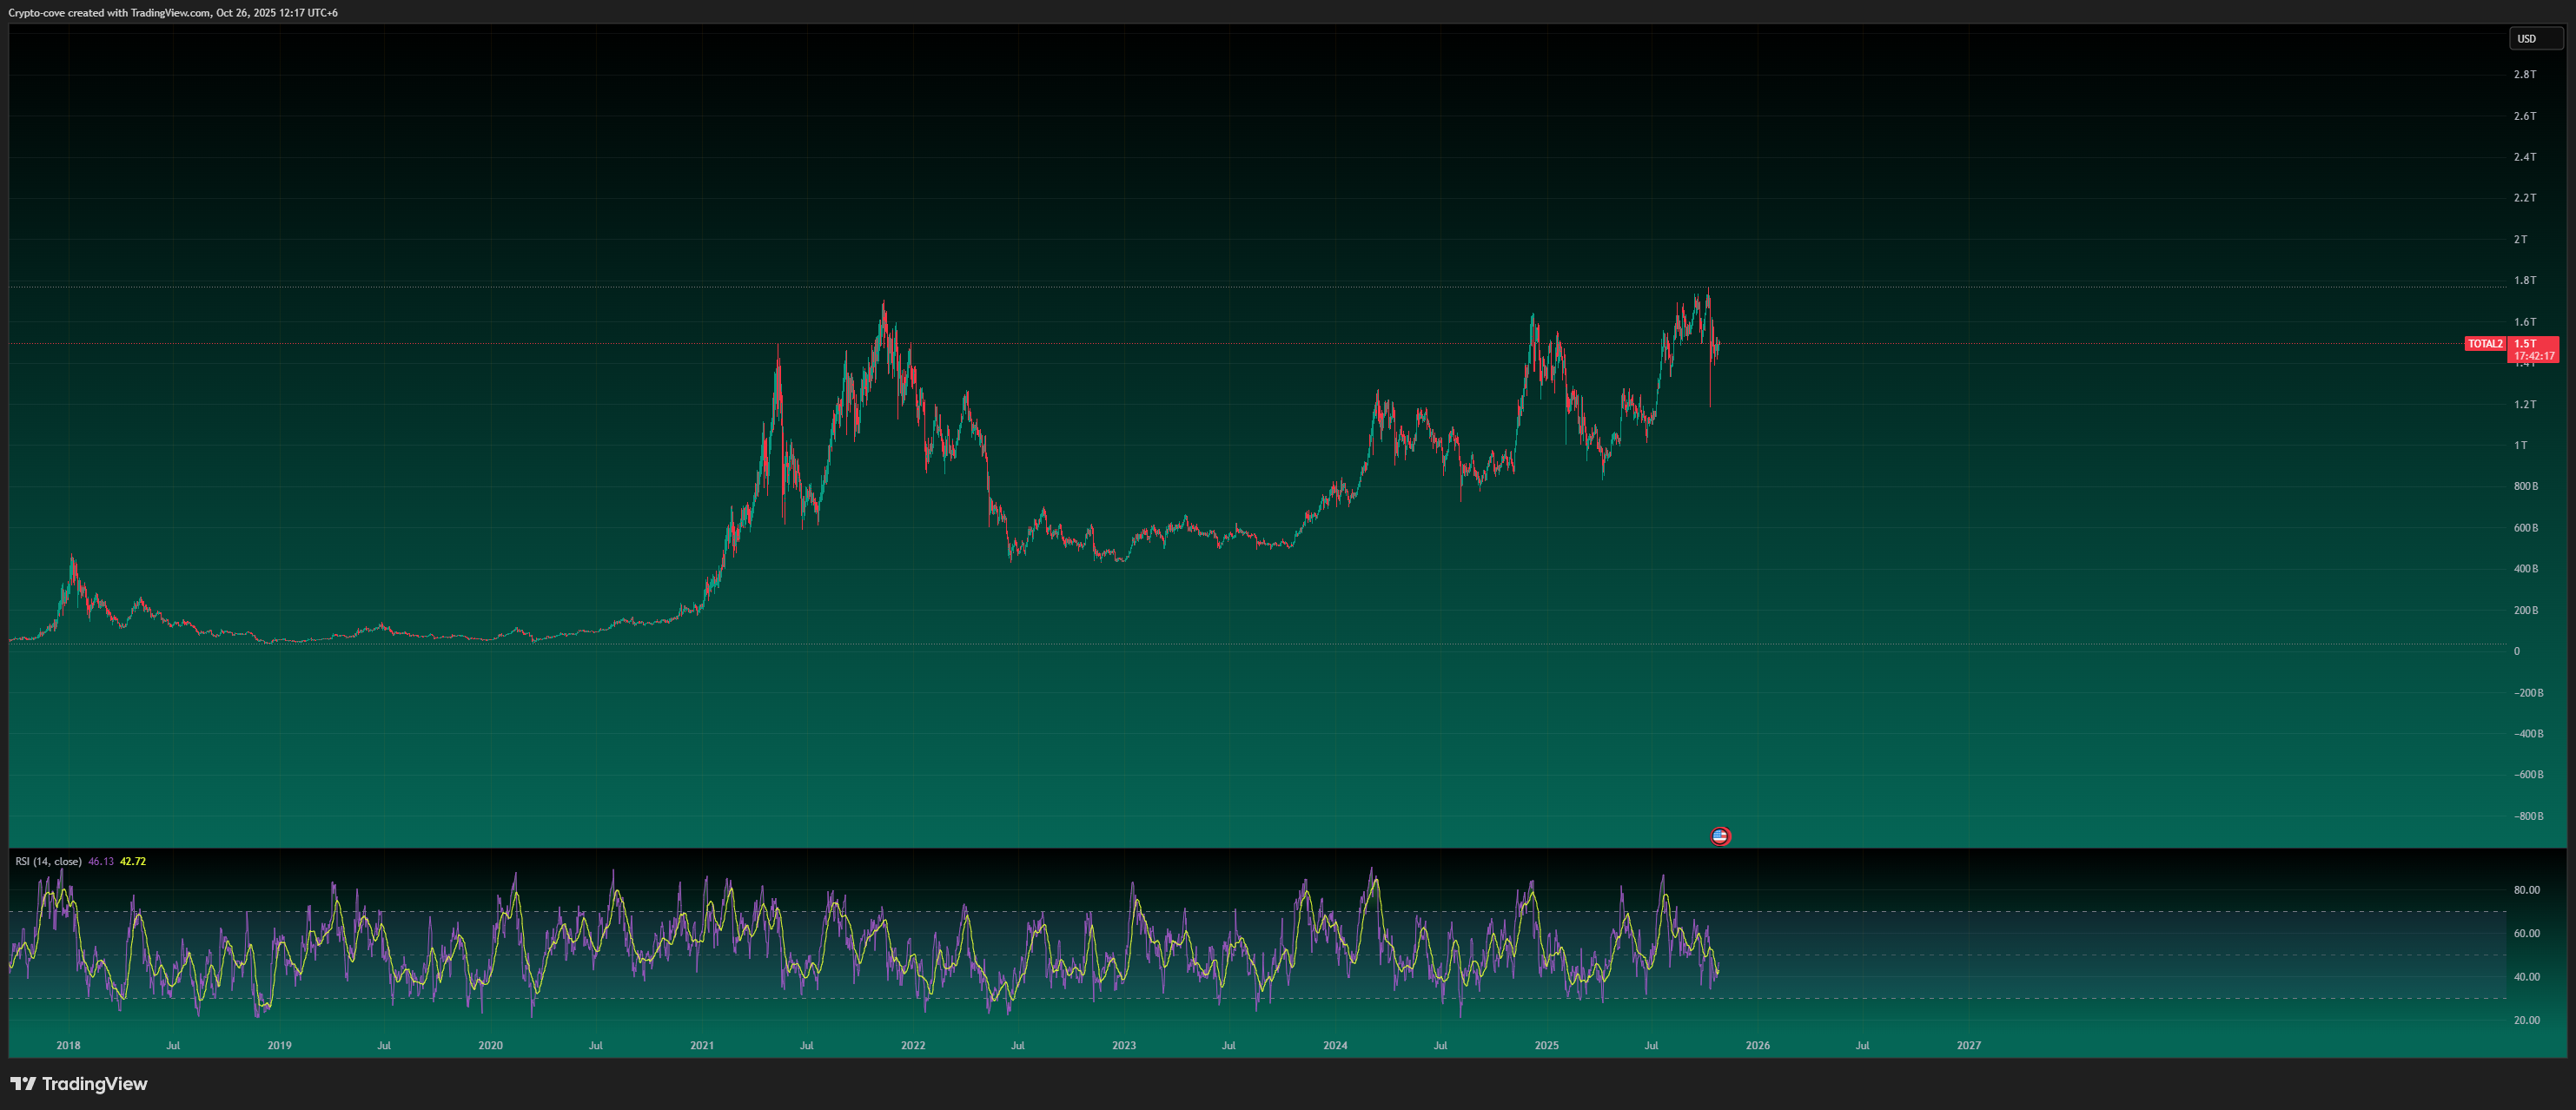
💠 TOTAL2 – The Altcoin Market (Excluding Bitcoin)
TOTAL2 removes Bitcoin’s market cap and shows the total value of all altcoins.
If TOTAL2 grows faster than TOTAL, it means altcoins are outperforming Bitcoin — a common sign that traders are rotating from BTC into altcoins.
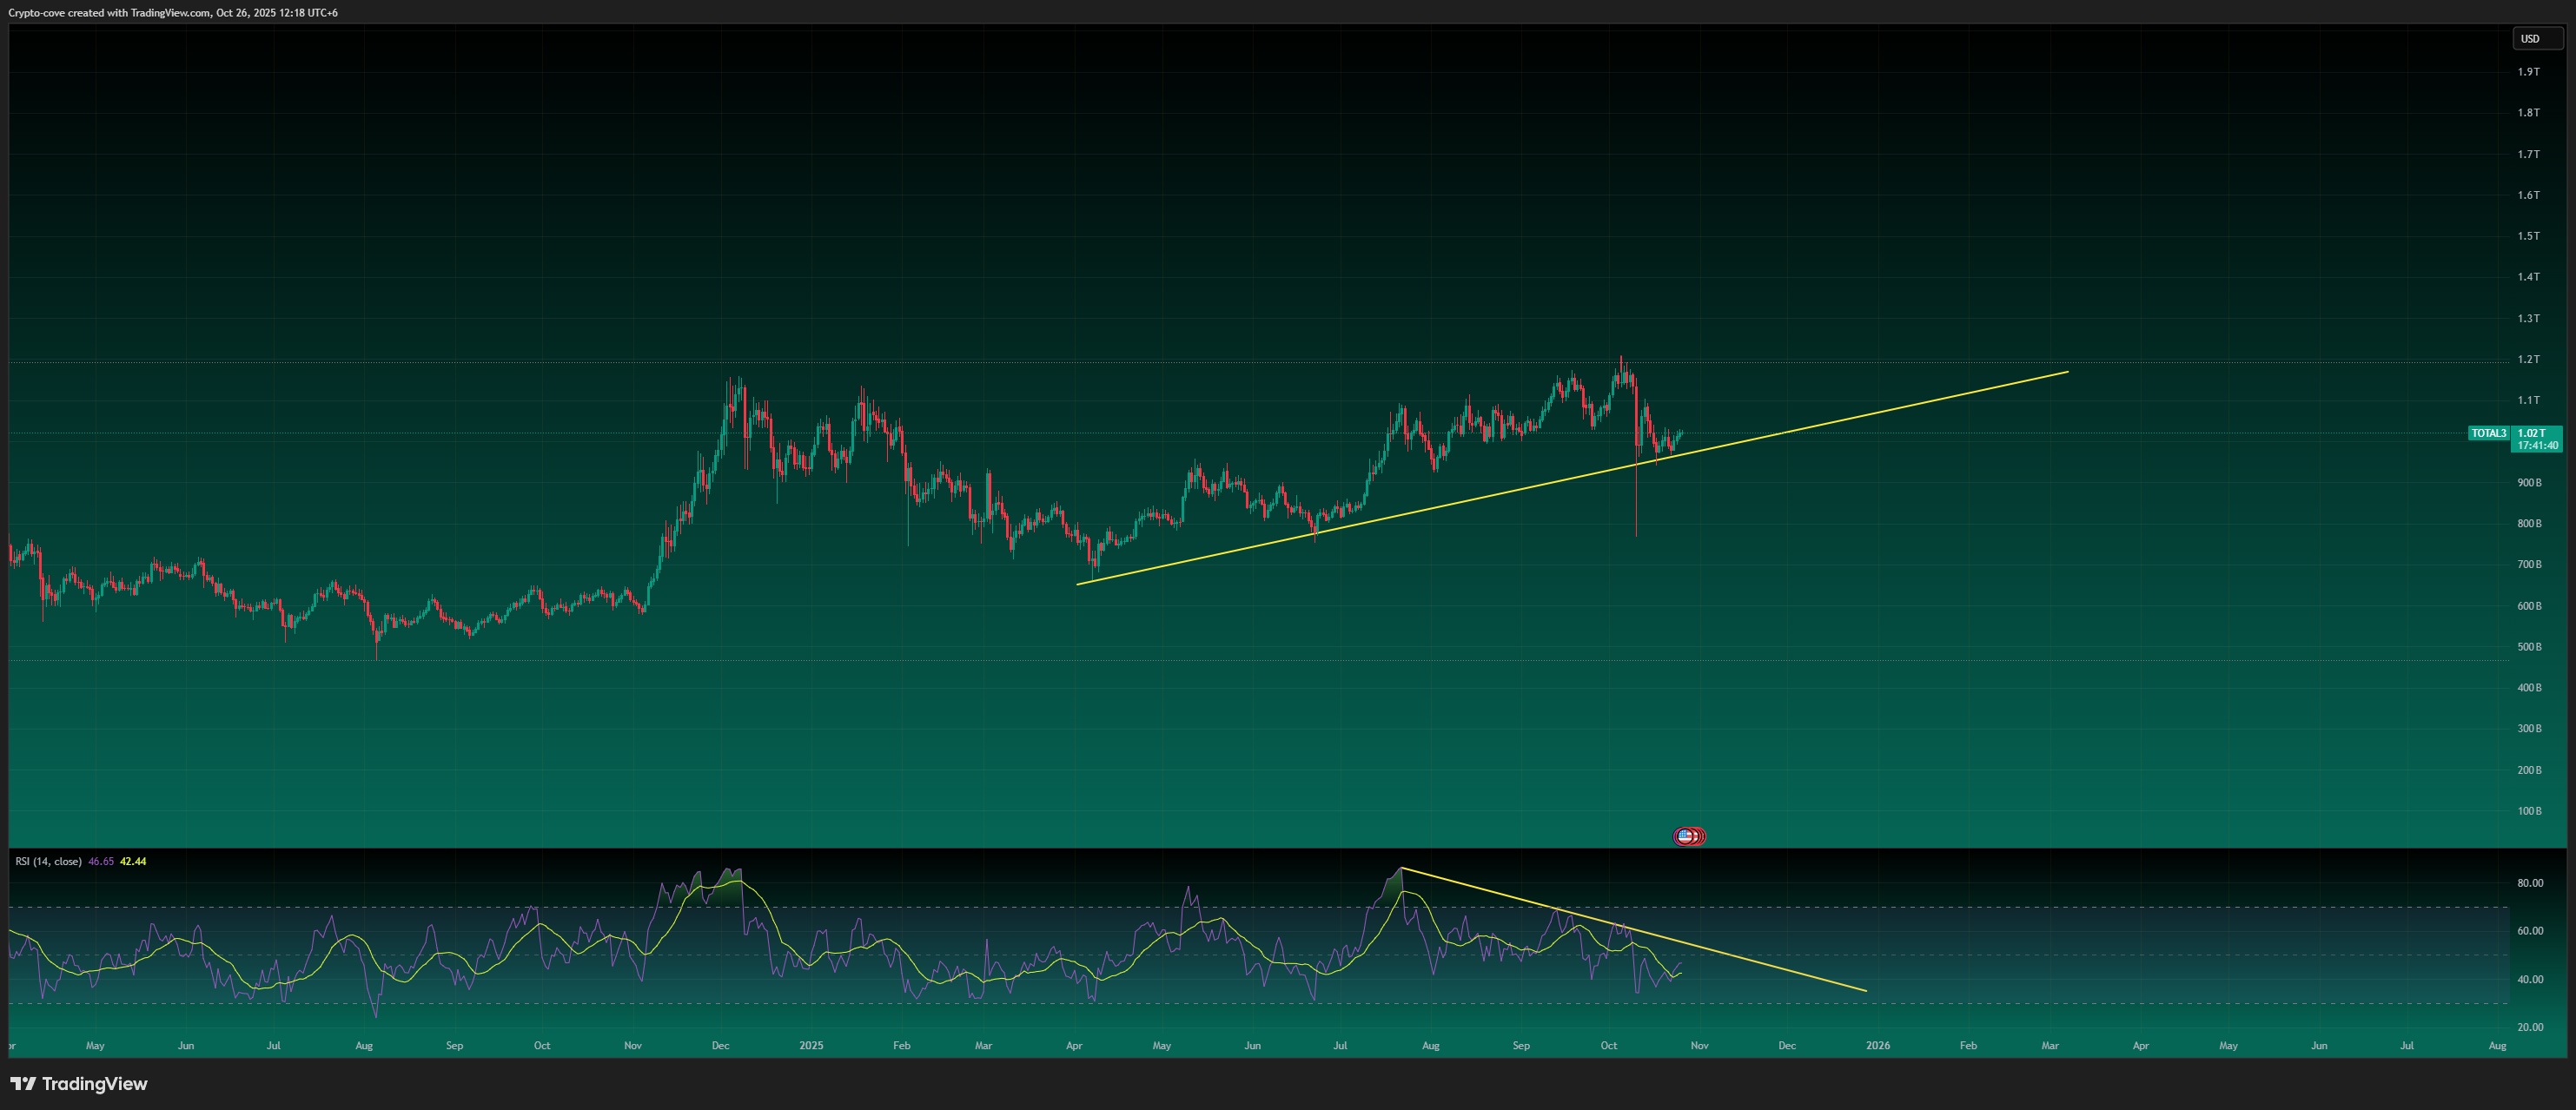
🔷 TOTAL3 – High-Cap Altcoin Index (Excluding BTC & ETH)
TOTAL3 excludes both Bitcoin and Ethereum but still represents high-cap altcoins such as BNB, Solana, XRP, ADA, DOGE, AVAX, TRX, and TON.
When TOTAL3 pumps, it means the large-cap altcoin sector is leading the market.
Low-cap coins may also move, but TOTAL3’s weight mainly comes from these big names.
⚡ OTHERS – Mid-Cap and Low-Cap Altcoins
The OTHERS index tracks coins outside the top 10 by market cap.
This is your best view of the mid-cap and low-cap market.
When OTHERS pumps strongly, it shows capital rotation into smaller coins — a clear altcoin expansion or late-stage bull phase.

🧮 Why We Remove Stablecoin Market Caps
Stablecoins like USDT, USDC, and DAI move opposite to the crypto market trend.
When stablecoin dominance rises, it means traders are converting crypto back into stable assets — a bearish signal.
If dominance falls, money is flowing from stablecoins into crypto, showing renewed risk appetite.
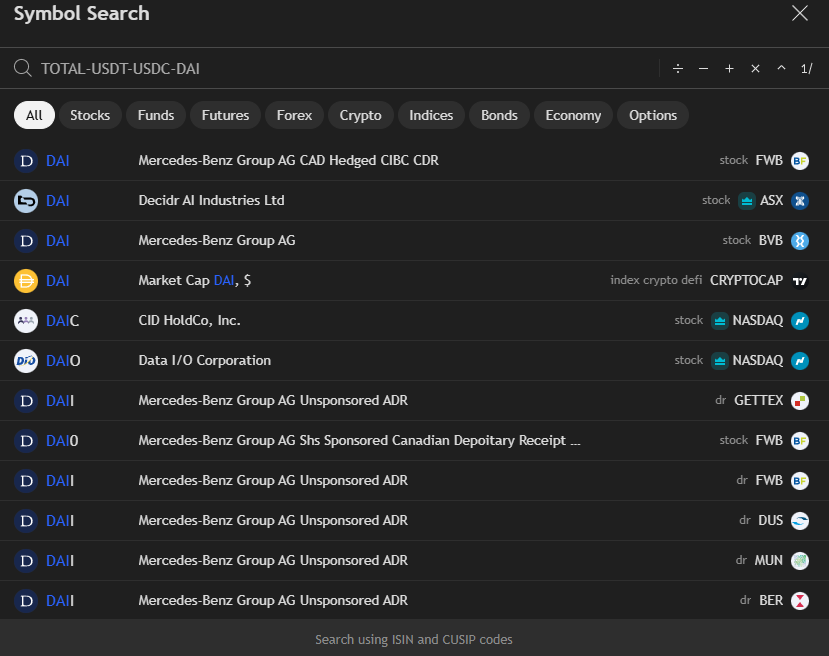
Because of this, you should remove stablecoin caps from every index to see true market strength:
TOTAL - USDT - USDC - DAI
TOTAL2 - USDT - USDC - DAI
TOTAL3 - USDT - USDC - DAI
example
✅ This gives a clearer chart and helps you spot real buying pressure instead of fake strength created by parked stablecoins.
⚖️ Cross-Index Comparison — Finding the Strongest Sector
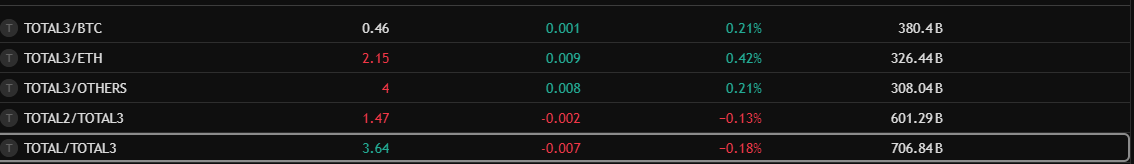
Sometimes, all indices pump together. To find where the real power is, compare one index to another using TradingView ratios:
TOTAL / TOTAL2 → Compare Bitcoin vs Altcoins
Bullish: Bitcoin leading the market → Focus on BTC.
Bearish: Altcoins outperform → Shift toward alt positions.
TOTAL2 / TOTAL3 → Compare Ethereum vs High-Cap Altcoins
Bullish: Ethereum stronger → Favour ETH over others.
Bearish: High-cap alts (BNB, SOL, XRP, etc.) leading → Allocate toward major alts.
TOTAL3 / OTHERS → Compare High-Caps vs Mid/Low-Caps
Bullish: High-caps outperform → Stick with large, established coins.
Bearish: Mid/low-caps stronger → Hunt for smaller alt opportunities.
📈 Why Traders Focus on Indices
Market indices give traders the true direction of the market.
Individual coins can mislead you — some look bullish, some bearish, some neutral — and that confusion often causes losses.
If the main index (like TOTAL or TOTAL2) is bearish, even a bullish-looking coin will usually follow the broader market down.
That’s why professional traders always analyze the index trend first, then look for setups inside that trend.
✅ Index bullish → Look for long positions.
🚫 Index bearish → Stay defensive or short-term.
These are core trading basics before diving into technical or fundamental analysis. Once you master index analysis, every chart and every trade setup makes more sense.
🧠 Final Thoughts
TOTAL = Whole market
TOTAL2 = All altcoins
TOTAL3 = High-cap alts (BNB, SOL, XRP, etc.)
OTHERS = Mid/low-cap alts
Stablecoin dominance up → crypto weak.
Cross-compare indices to know where capital is flowing.
By tracking these indices together with Bitcoin Dominance (BTC.D) and stablecoin flows, you can clearly read market structure, anticipate rotation phases, and always trade in line with the real trend — not just individual coin noise.